💲Financial 🪬 Insight: Charts (2)
A Sunburst chart of our 2022 sales projections


By: Mitch Wooderson
🕵🏻 How to Interpret This Chart:
The highest values Start at 12 o'clock and move counter clockwise. The more space each takes up the higher the projected sales. The numbers around the outside are the week number that belong to each month.
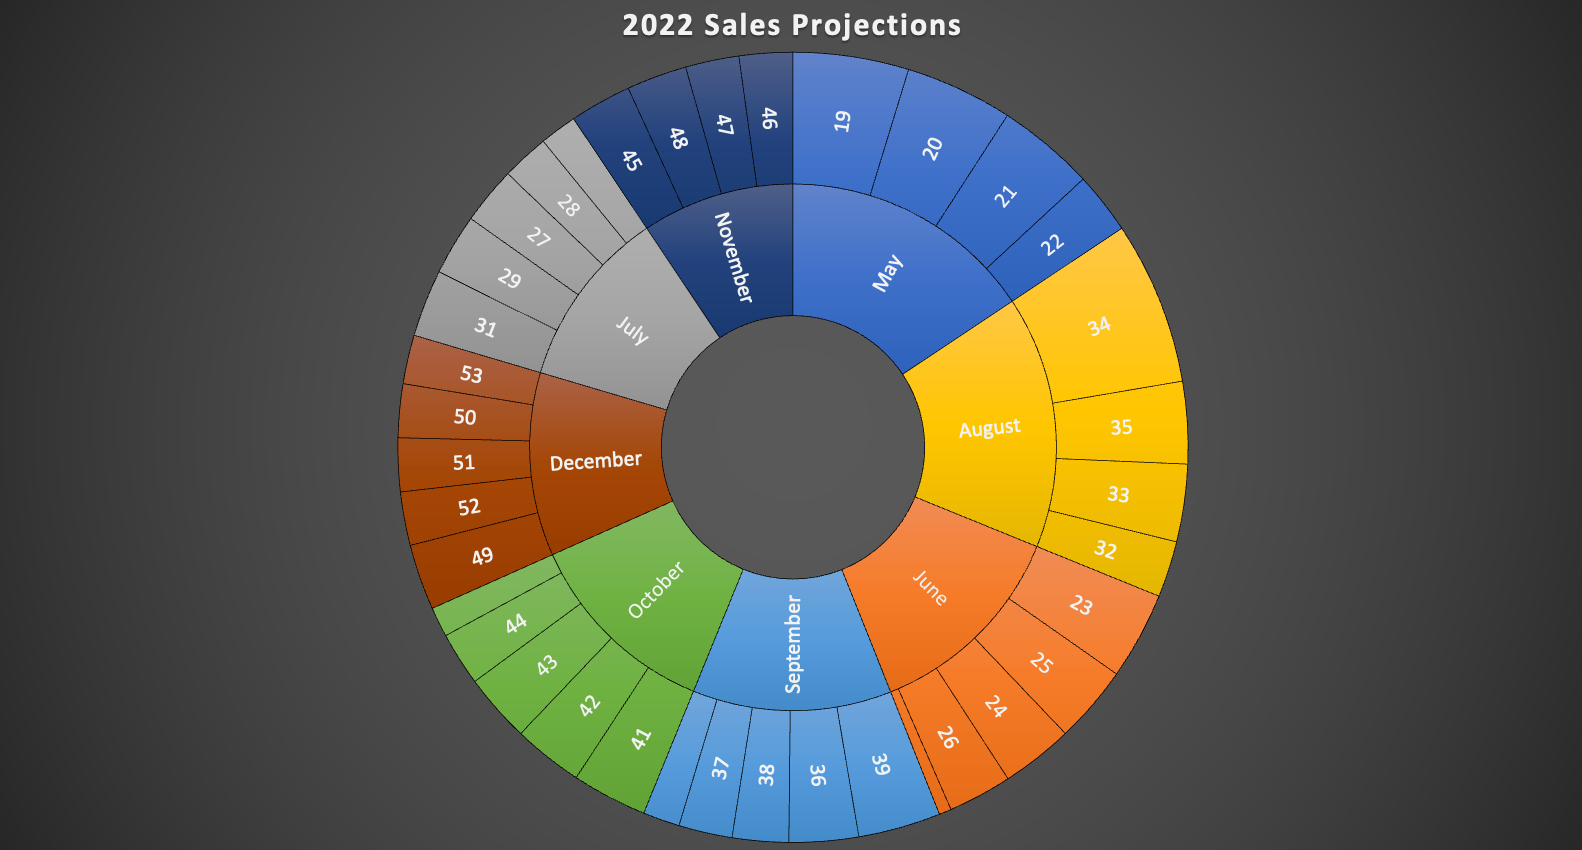
Analysis
- May sales are highest because it's a busy month (obviously) and it's fully booked.
- This chart could change if big events booked in future months. As of now projections are running off of booked events and overall average, since we don't have a year of history.
- July sales are low. We have a couple vacations planned, and not as many festivals.