March🍀 Financial💰 Analysis📊

What's the Purpose?
The main purpose of writing this is separating the financial signal from noise. Since TUCKEDito isn't even a year old I don't have any years to compare to. To start I am just trying to get a feel for our numbers. I want to understand metrics that are important to our business.
I'm sure I'll look back on this in a year and think "pshhhhh...what the hell was I doing", but that'll be because I've learned from taking the time to do this each month.
To start, these are my two main focuses:
- Identifying patterns and drawing conclusions from the high level numbers. Then, thinking how I can improve our financial health by reversing the negative trends and keeping the positive trends.
- Creating charts so that I have a visual representation. I believe creativity is important in the learning process.
Note: I'm not sure that what I am doing is the best way to go about financial analysis but I do feel it's productive.
Profitability Breakdown
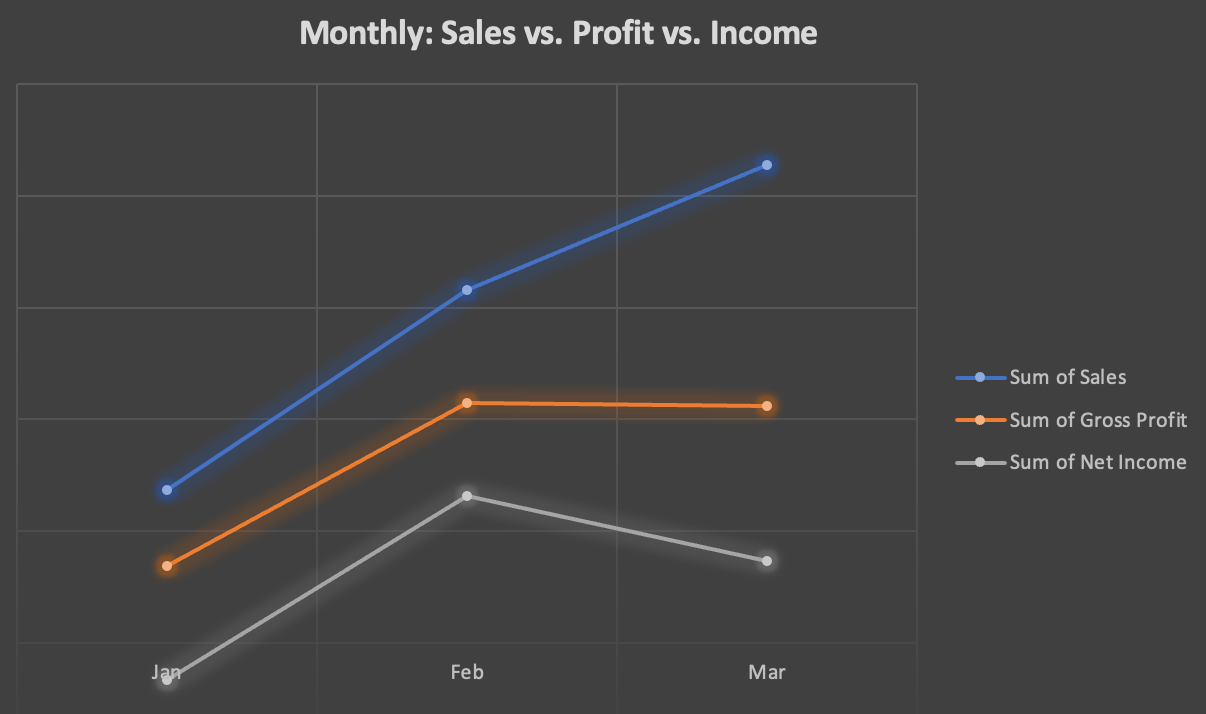
What do I see?
Well, sales is trending up since the start of the year (with the weather warming we are getting busier so that is expected.) Gross profit and net income did not follow sales up-trend for March, a red flag 🚩.
What does this mean?
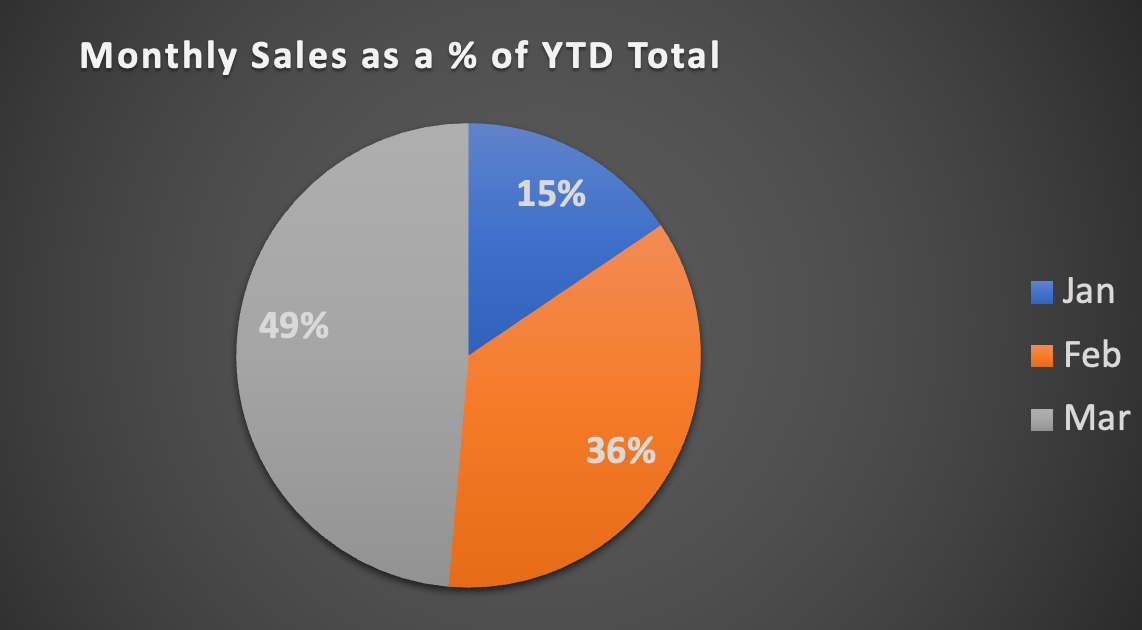
We brought in much more money in March than February (March sales were almost as much as January and February combined), but our expenses were so great in March that our total cash inflow was less than February.
When net income doesn't follow sales I know the issue is expenses are up, bringing margins down. Because our profit is trending closer to net income instead of sales, I know that the bulk of those expenses are in our direct costs (food, packaging, energy).
What can we do?
- Look at our COGS. If they have risen to a point where our target profit margin is no longer attainable, we may need to raise prices.
- COGS increase not the reason? Maybe the production projections were a bit high therefore food waste was above average. Projections could be curtailed going forward.
- Still not there? Were any bulk purchases made that aren't made each month? That could increase expenses, but we should see an increase in profit margin next month because of this.
Our answer
As I detailed in our March: Price Update post, prices are up across the board. Right now we are living in a highly inflationary environment. The latest CPI print, as reported by the US Bureau of Labor statistics, was has inflation at 7.9%. We don't think we'll see a reversal in this as the energy supply is looking like it'll be squeezed for the foreseeable future.
With this being said, we need to raise our prices. (and buy more bitcoin)
We did also purchase packaging that should last us the next couple months.
So, it was a combination of 1 and 3. We hope to see a big jump in our profit margin % in April as we won't be buying as much packaging.
March Performance
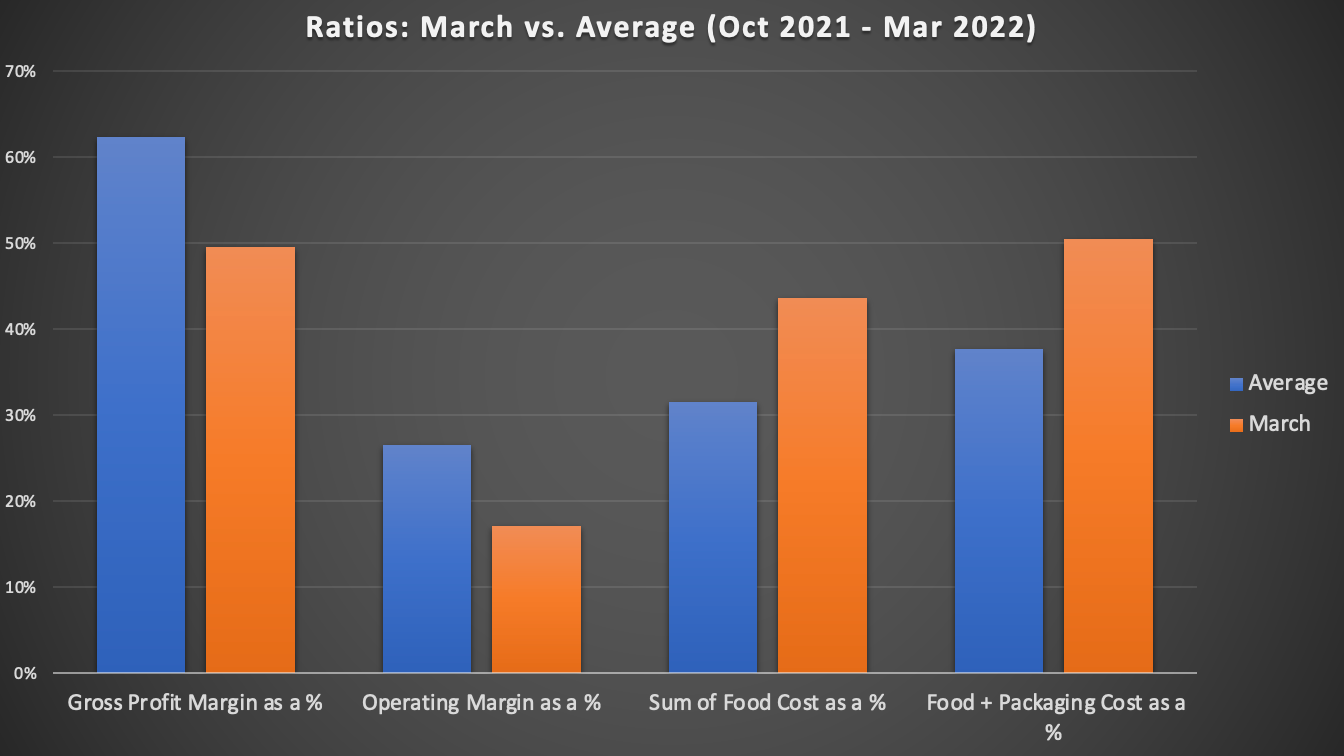
Everything is consistent with what has been discussed up to this point. I just wanted to reaffirm my conclusions with a visual representation.
Projections Update
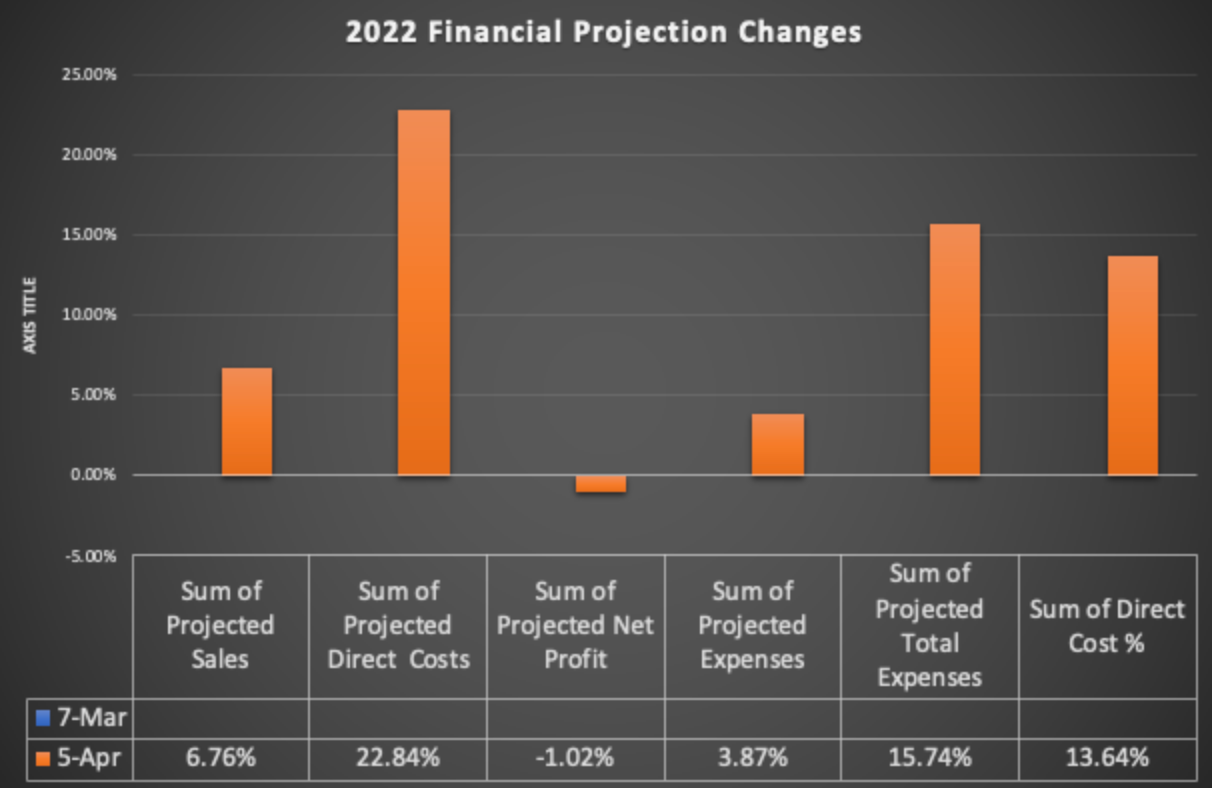
This chart shows how are projections for the remainder of 2022 have changed.
In a couple months this will be better as we will see month over month change against the average. Also, we will be able to see how much actual sales deviated from the projections, then we'll have a better idea of whats normal.
What do they mean?
Projected Sales - Result: Up 6.76%. Why? We booked some big events. Right now projections correlate to events we have booked, since we don't have previous years to project off of.
Projected Direct Costs - Result: Up 22.84%. Why? As we went over earlier, direct costs for March were high. Because of this, the projection factor for direct cost % increased. I would expect a decrease for next month.
Projected Net Profit - Result: Down 1.02%. Why? Projected sales increase and direct costs increase cancel each other out.
Projected Expenses - Result: Up 3.87%. Why? Expenses, outside of direct costs, remained pretty steady compared to other months.
Projected Total Expenses - Result: Up 15.74%. Why? We held our other expenses fairly steady, but direct cost % was up big due to bulk packaging buys and COGS increases. This leads to total expenses increasing going forward.
Projected Direct Cost % - Result: Up 13.64%. Why? This is the projection factor % that goes into direct costs. It is up because direct cost % was high in March.
Improvements to Come
This is just the start. I plan on having more charts to show the nuances of the business. I want to develop KPI's and a benchmark for each. Once we have that and can illustrate it, we will need action plans to employ if a benchmark is not met.
Would love some better ways to look at financials. If you're reading this and have useful ratios or charts I can try out, I'd love to hear from you!
Send suggestions to: tuckedito@gmail.com, instagram dm, fb dm
 Tuckedito