💸 Costs Update: 🐰 April 2022
Where our food prices stand at as of today. Charts included for visualization.

By: Mitch Wooderson
Prices Are Up :(
We're now starting to look at price changes month over month. I'm not including the March 2022 vs September 2021 prices because it will not match up when everything else is month over month.
If you want to see the prices changes from Sept 2021 to Mar 2022 you can look at them here 👇🏻
 Tuckedito
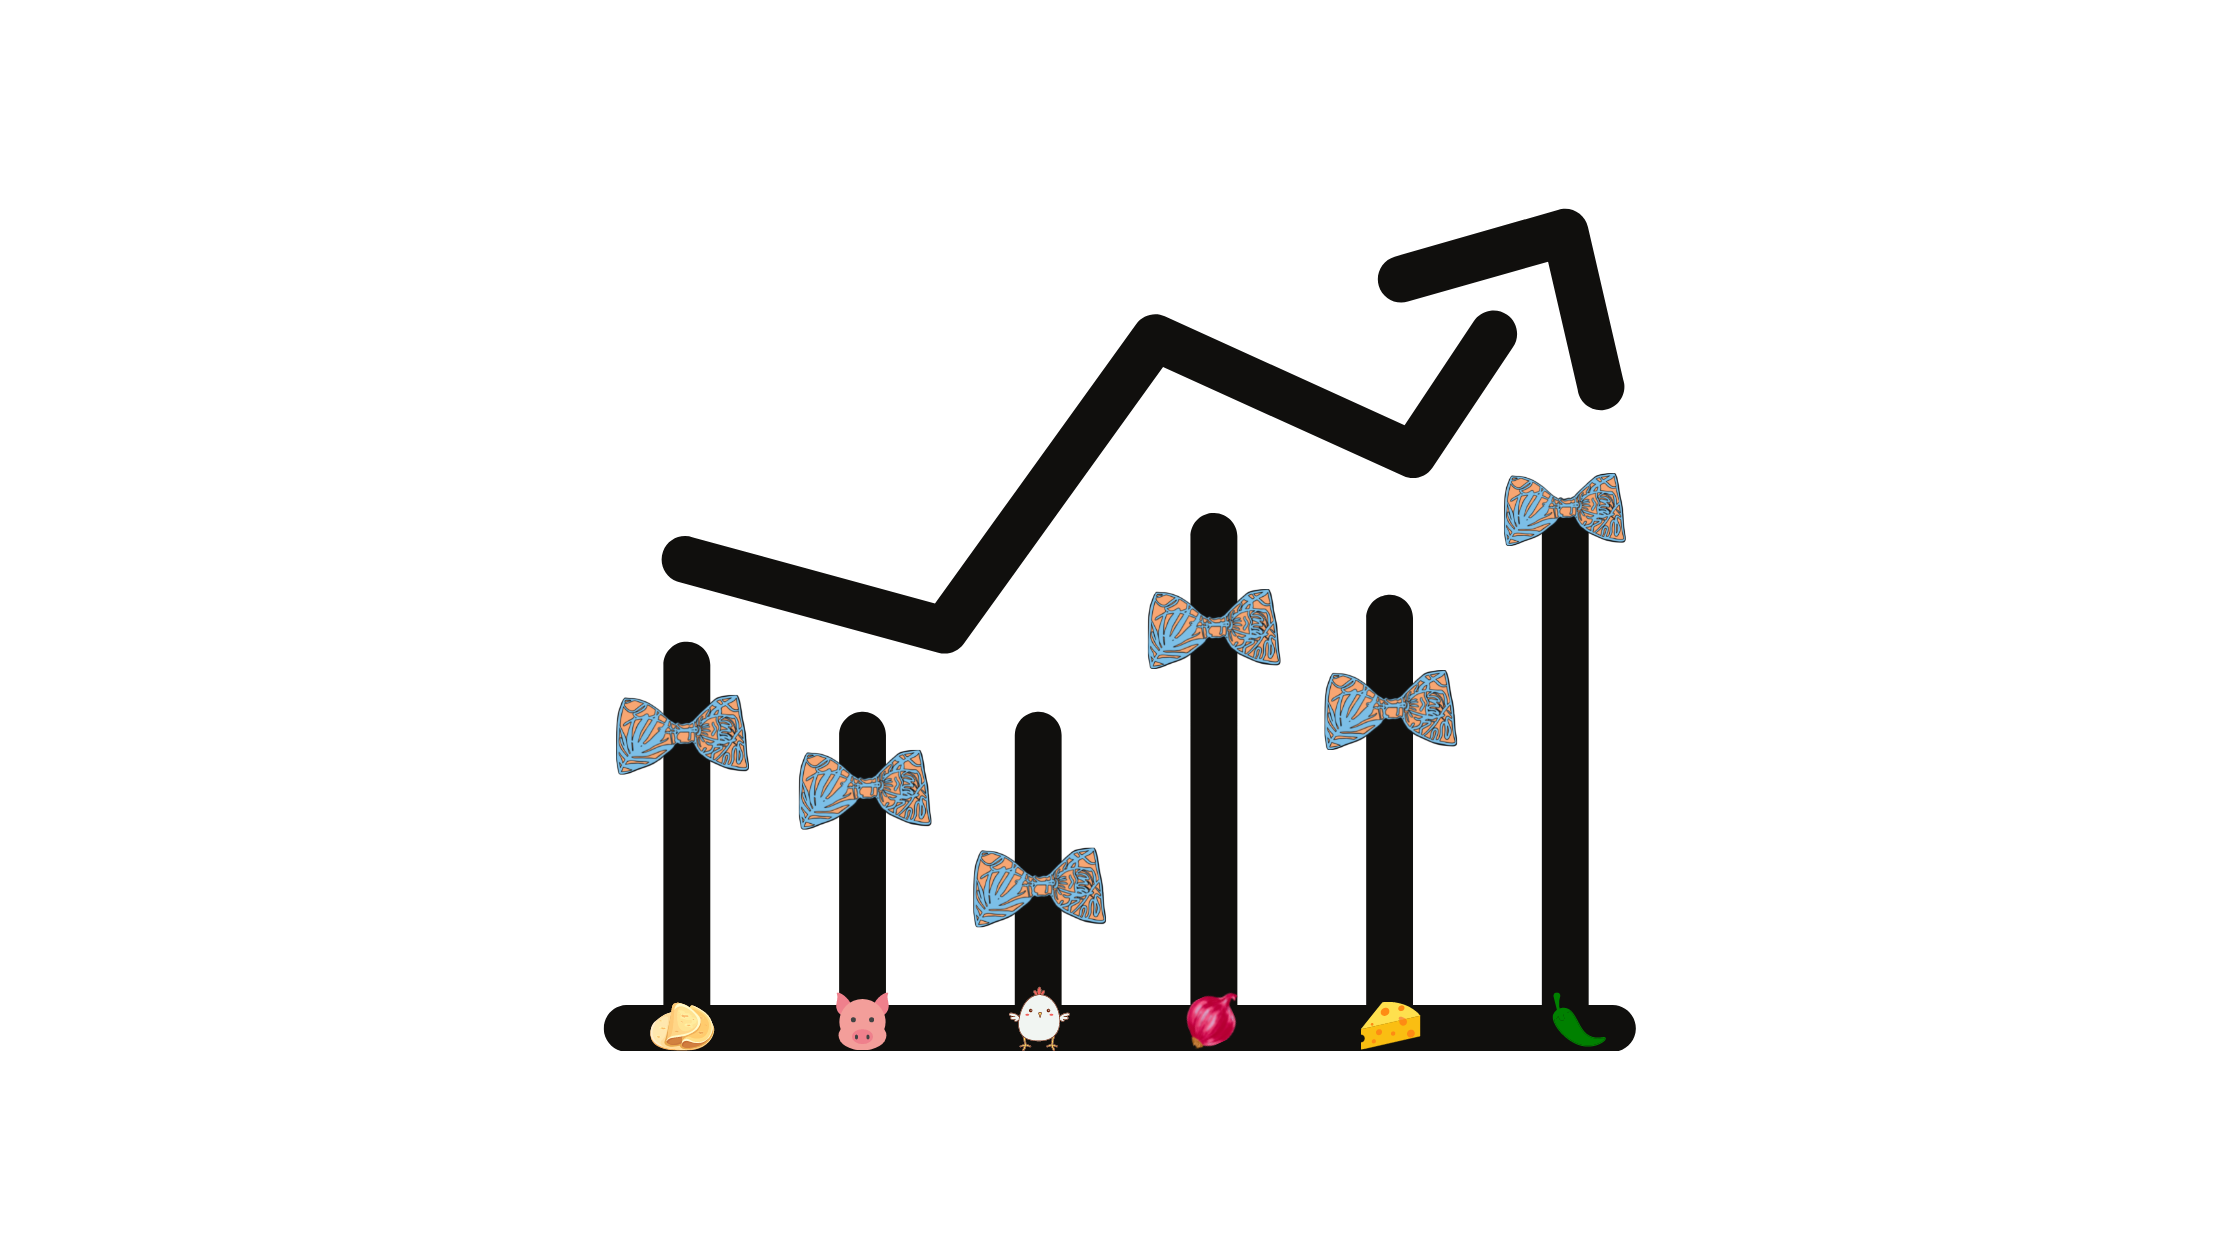
Alright, now let's look at some charts!
MoM (Month over Month) % Increase in Per Unit Cost
What is this chart is showing me?
The detail behind the chart: Prices are updated for every individual item. Once the purchase price is updated, we have a new cost for unit of measure "Per Unit".
This takes the new per unit cost, groups all items by their subgroup to gather the total subgroup change, and then compares to the previous month
What do I see?
Up
Dairy: The price we've been paying for cheese has increased a good bit.
Meat: After no price increase in our chicken over 6 months, it jumped 10% this morning. At 8% meat isn't the top mover but as you'll see below our meat makes up 38% of the total cost of our menu, so it increasing hurts us more than increases in dairy or sauces.
Down
Produce: Now that we're busier we are consistently buying in bulk. We also found a better supplier. So a double whammy, in a good way, for us.
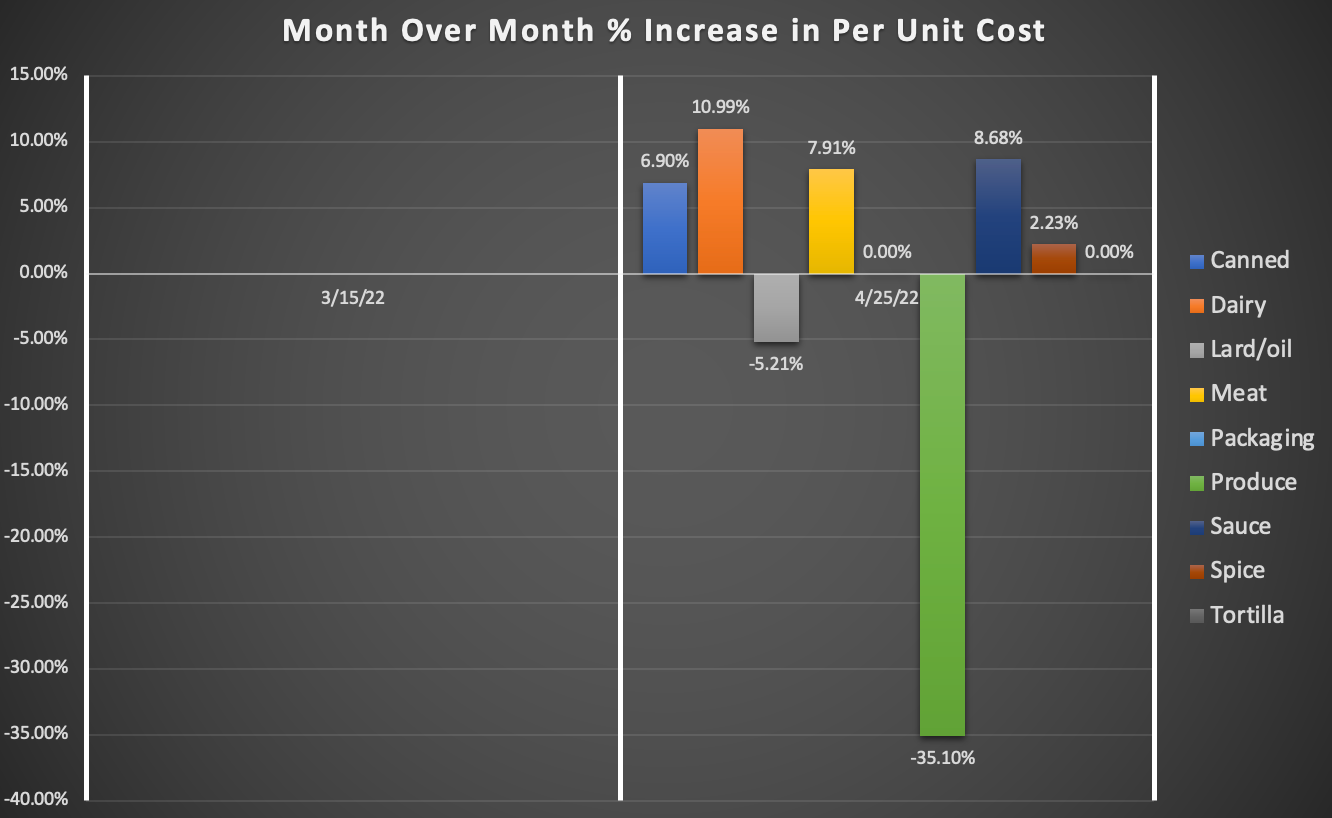
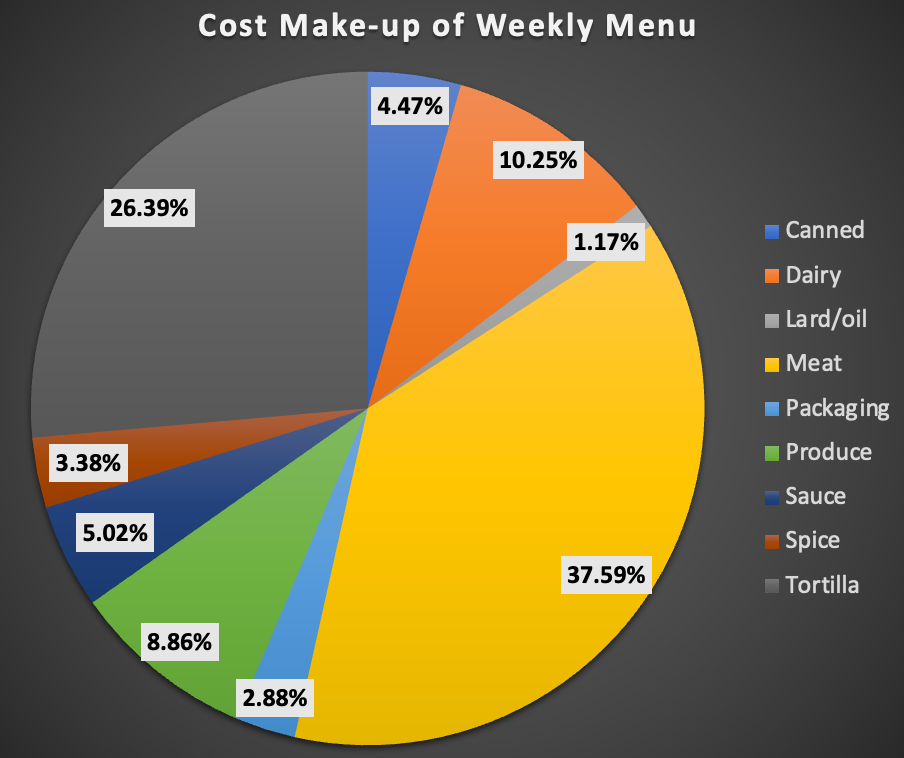
April Cost Make-up of Weekly Menu
What is this chart is showing me?
What makes up the cost of this week's menu. The prices are from this month.
What do I see?
Tortillas are in every item we offer and we're stilling buying them at a grocery store retail price. We need to find cheaper ones, and have been trying for a while, but have not had any success yet.
Looking back...
Cost for "Mock-up" Menu
What is this chart is showing me?
The cost of this week's menu compared to what it would cost us if we use prices from previous months.

What do I see?
Prices are going up haha. pretty simple
Hopefully that gif will look different in the next article!