March 24 🍀 Financial💰 Analysis📊
it's getting warmer


By: Mitch Wooderson
Want to see last month's post?👇🏻
 Tuckedito
Want to see last year's post?👇🏻
Tuckedito
🏦 Profitability Breakdown
💰Sales , Profit, & Net Income
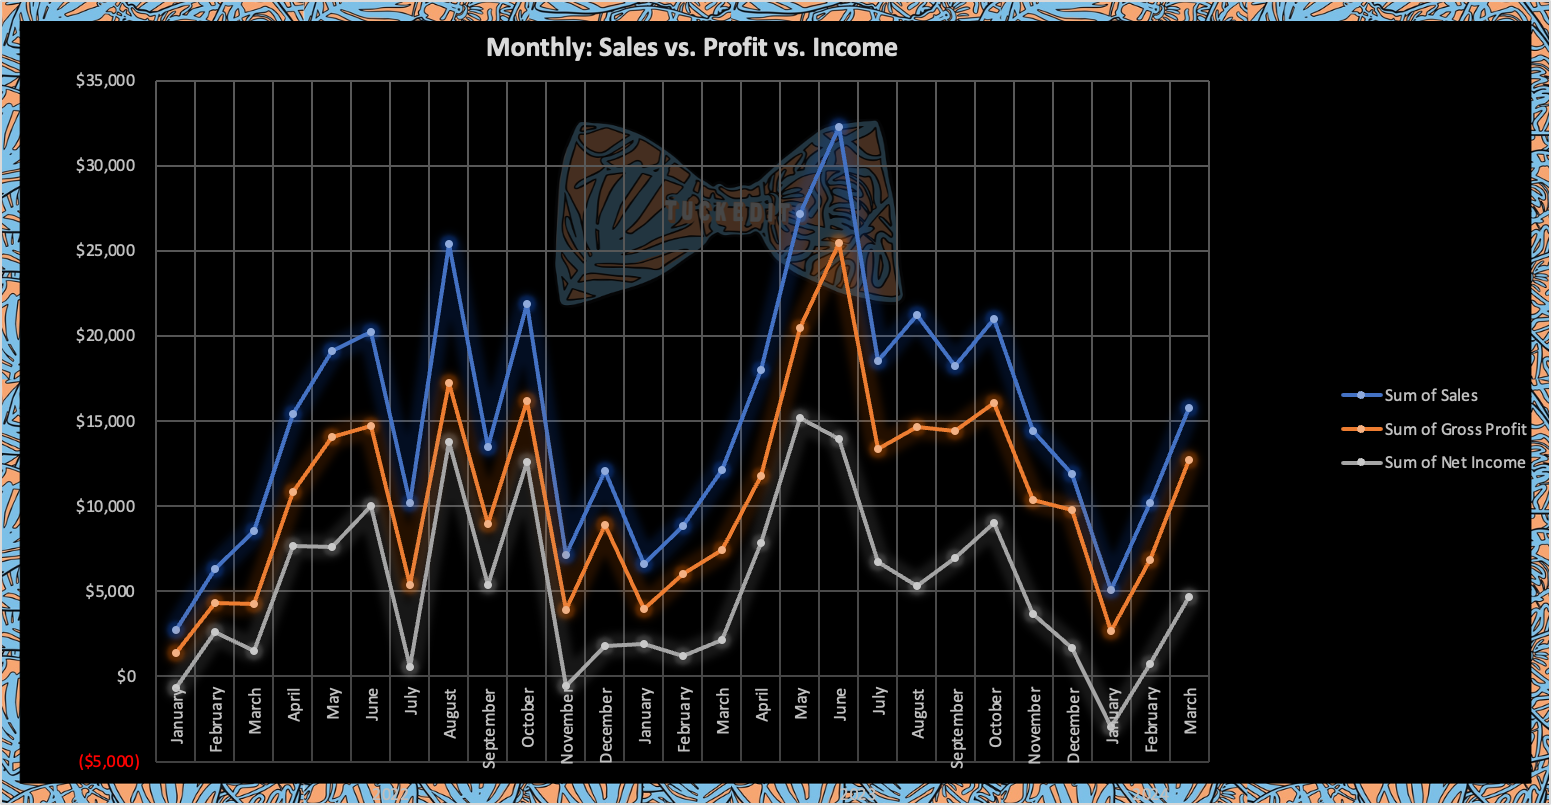
Starting back on the uptrend.
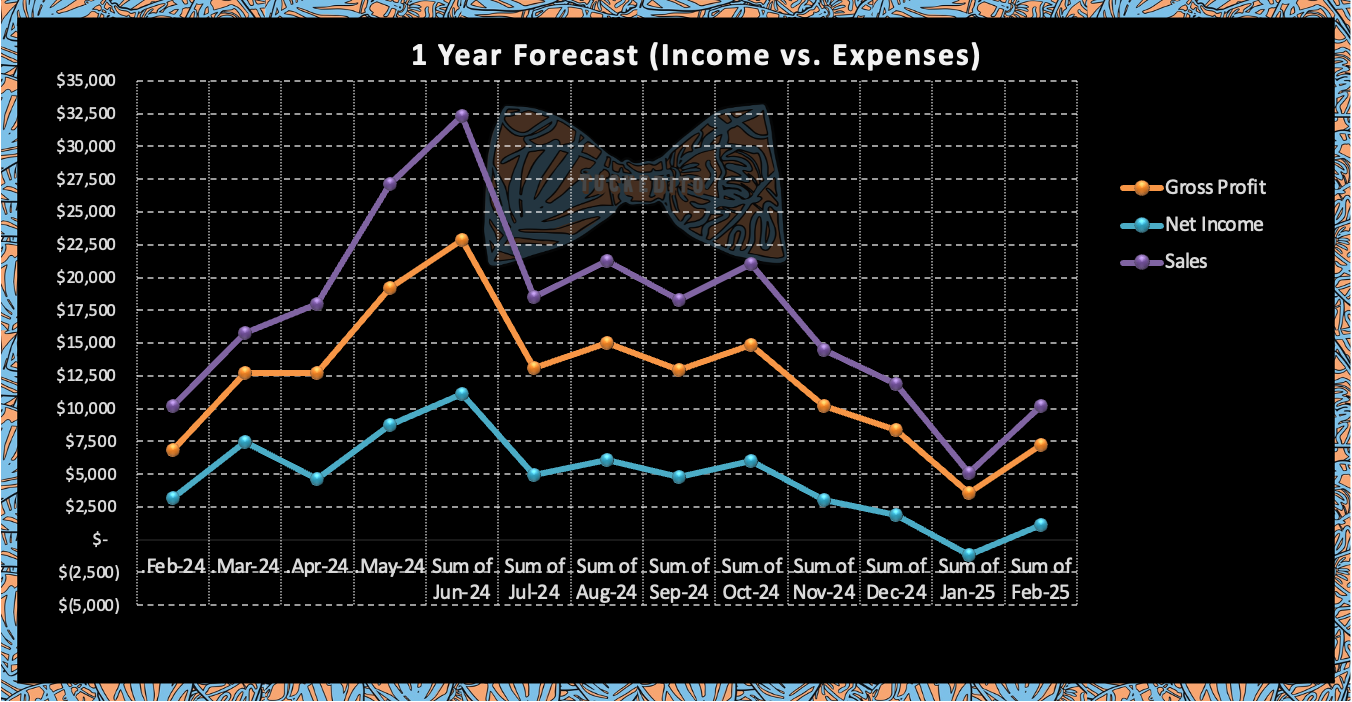
🔭Projecting out a Year
💰Sales As Year over Year
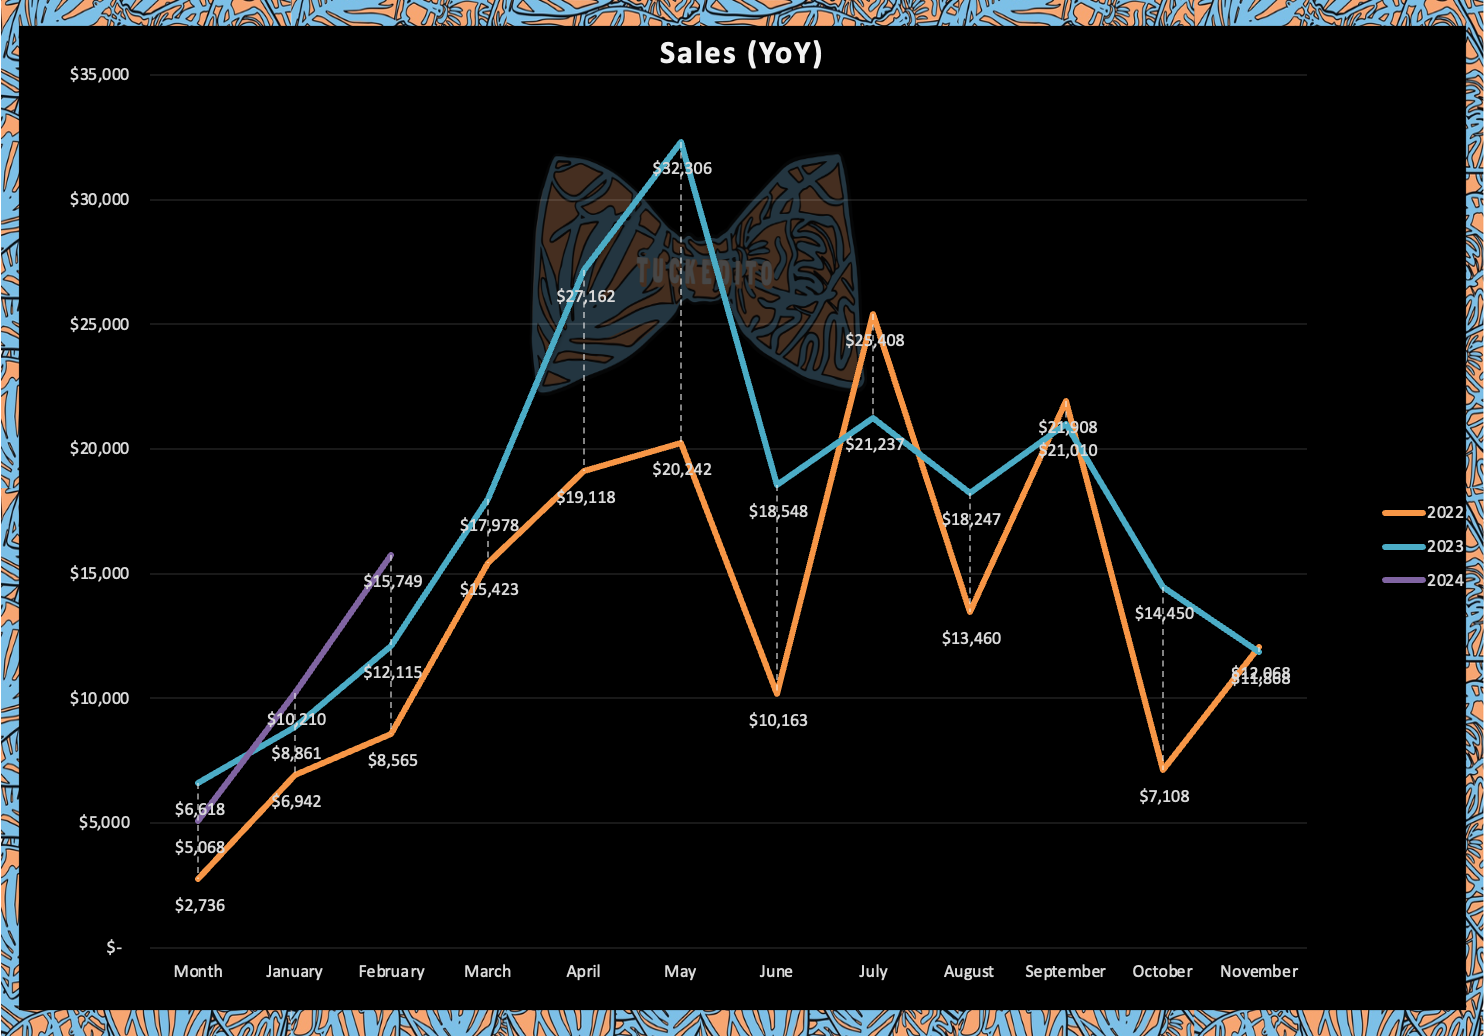
Another increase. About 30% higher for March. A lot of deposit payments though. I wouldn't be surprised if May or June came in way under last year.
💰Sales As a Percentage
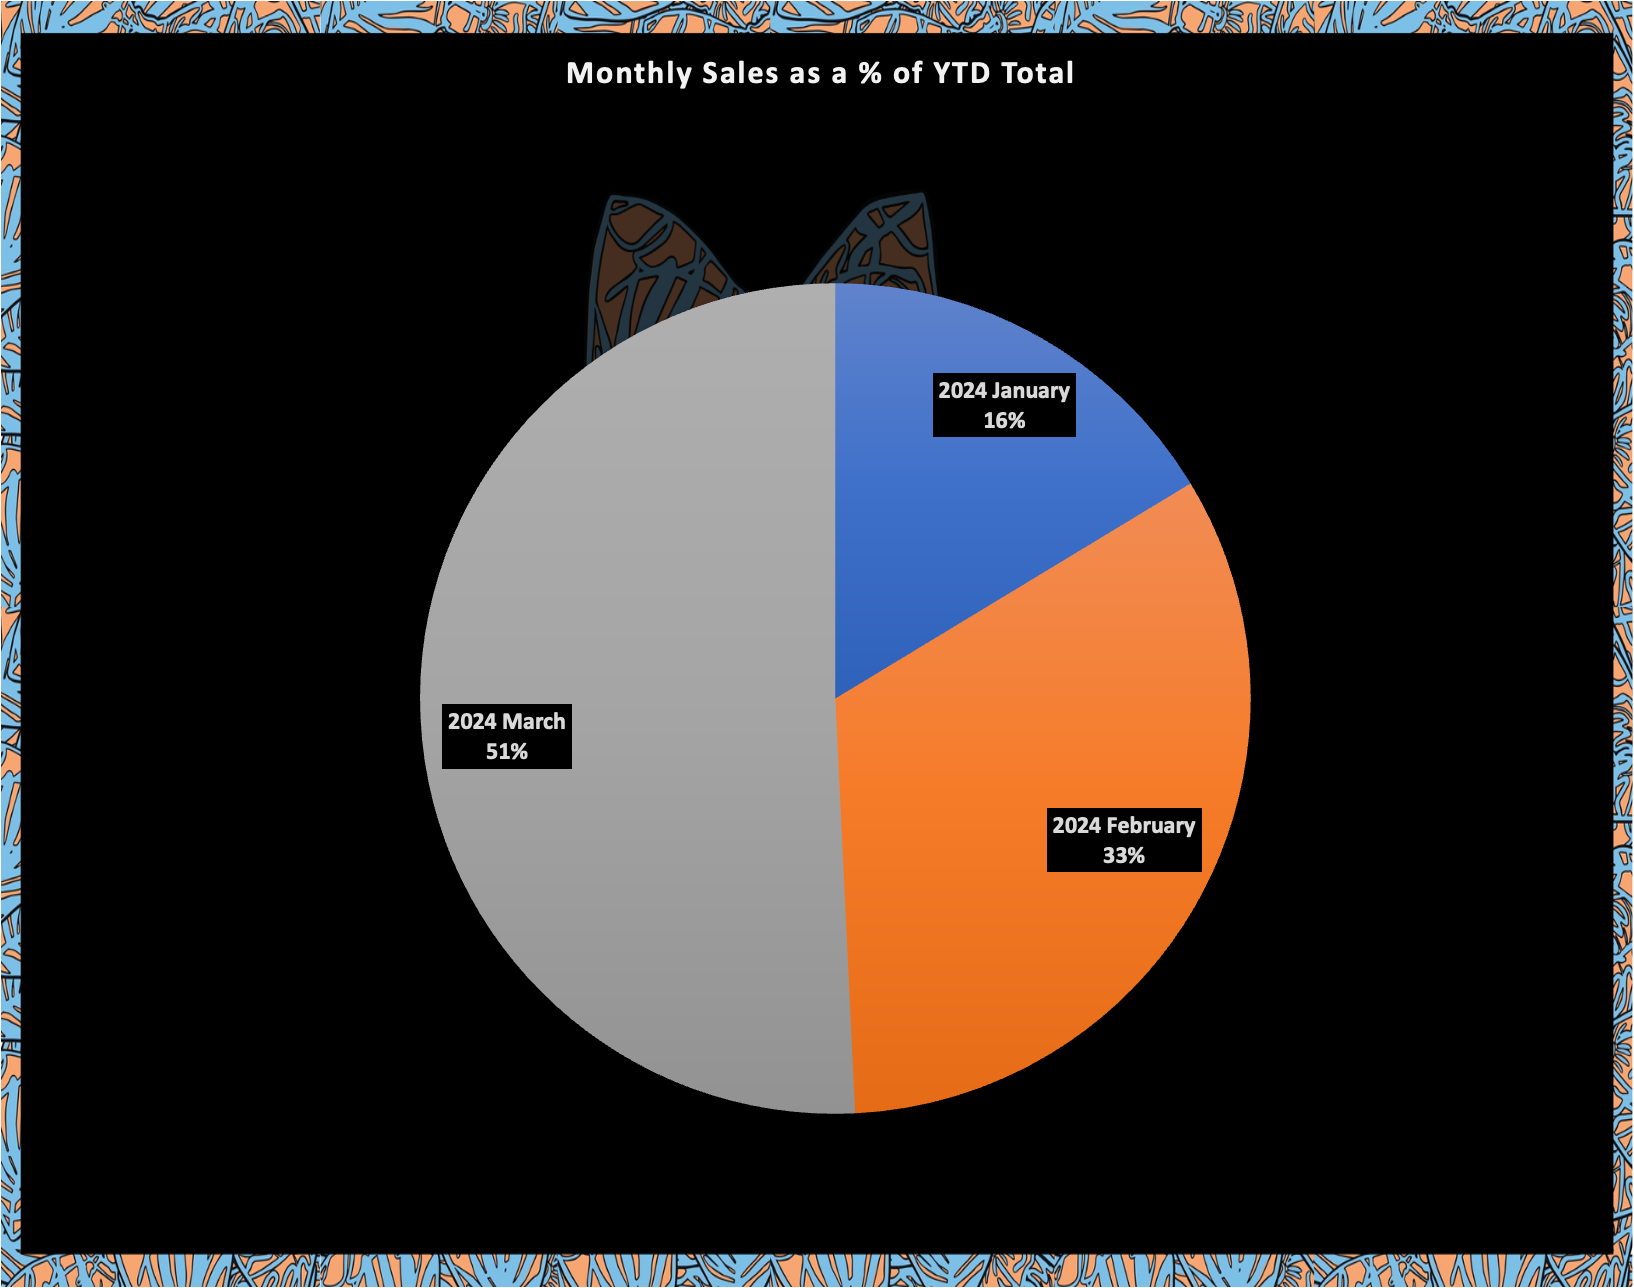
January and February are depressing months.
💰Sales Rankings
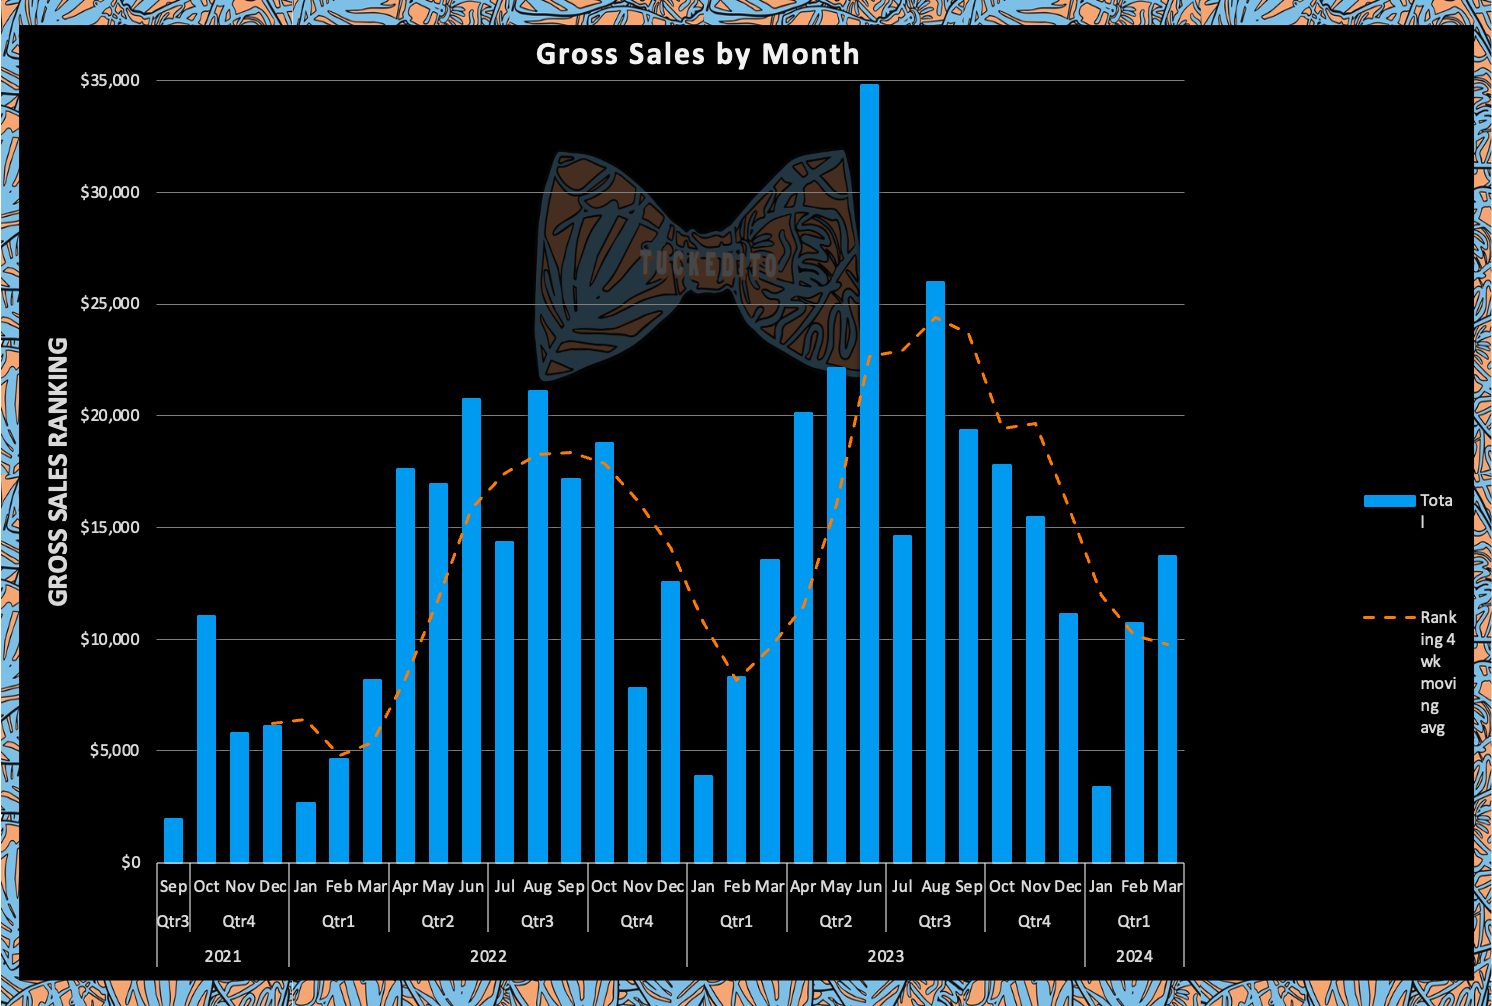
📝 Financial Performance
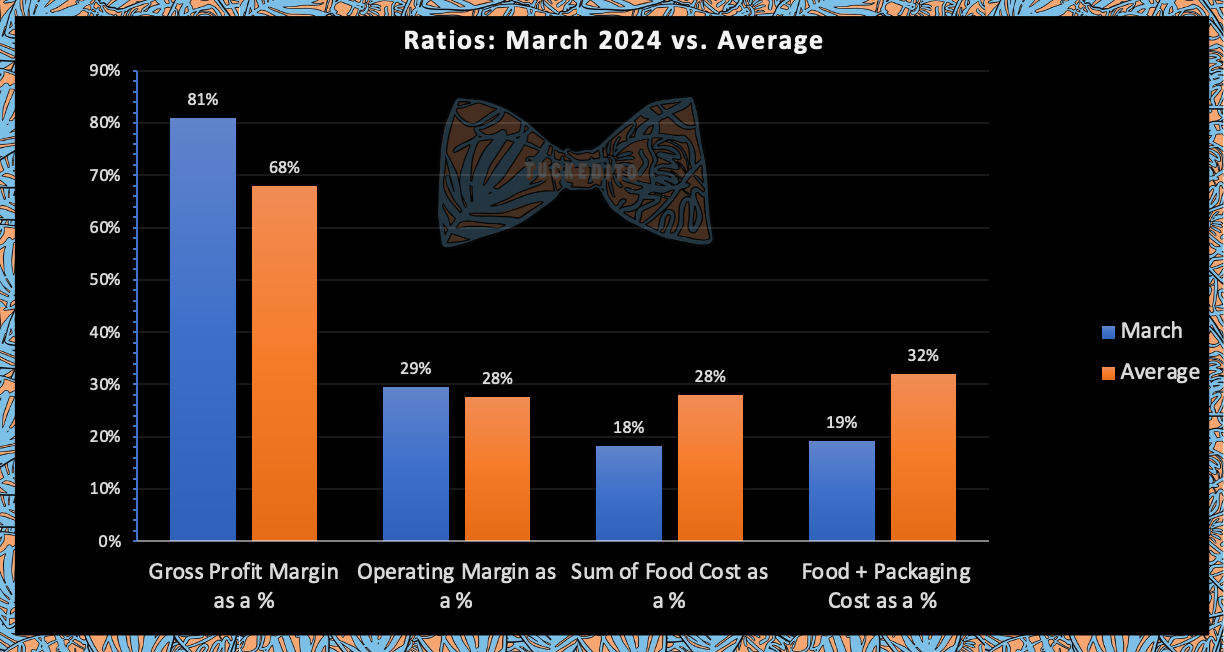
Better on the profitability front.
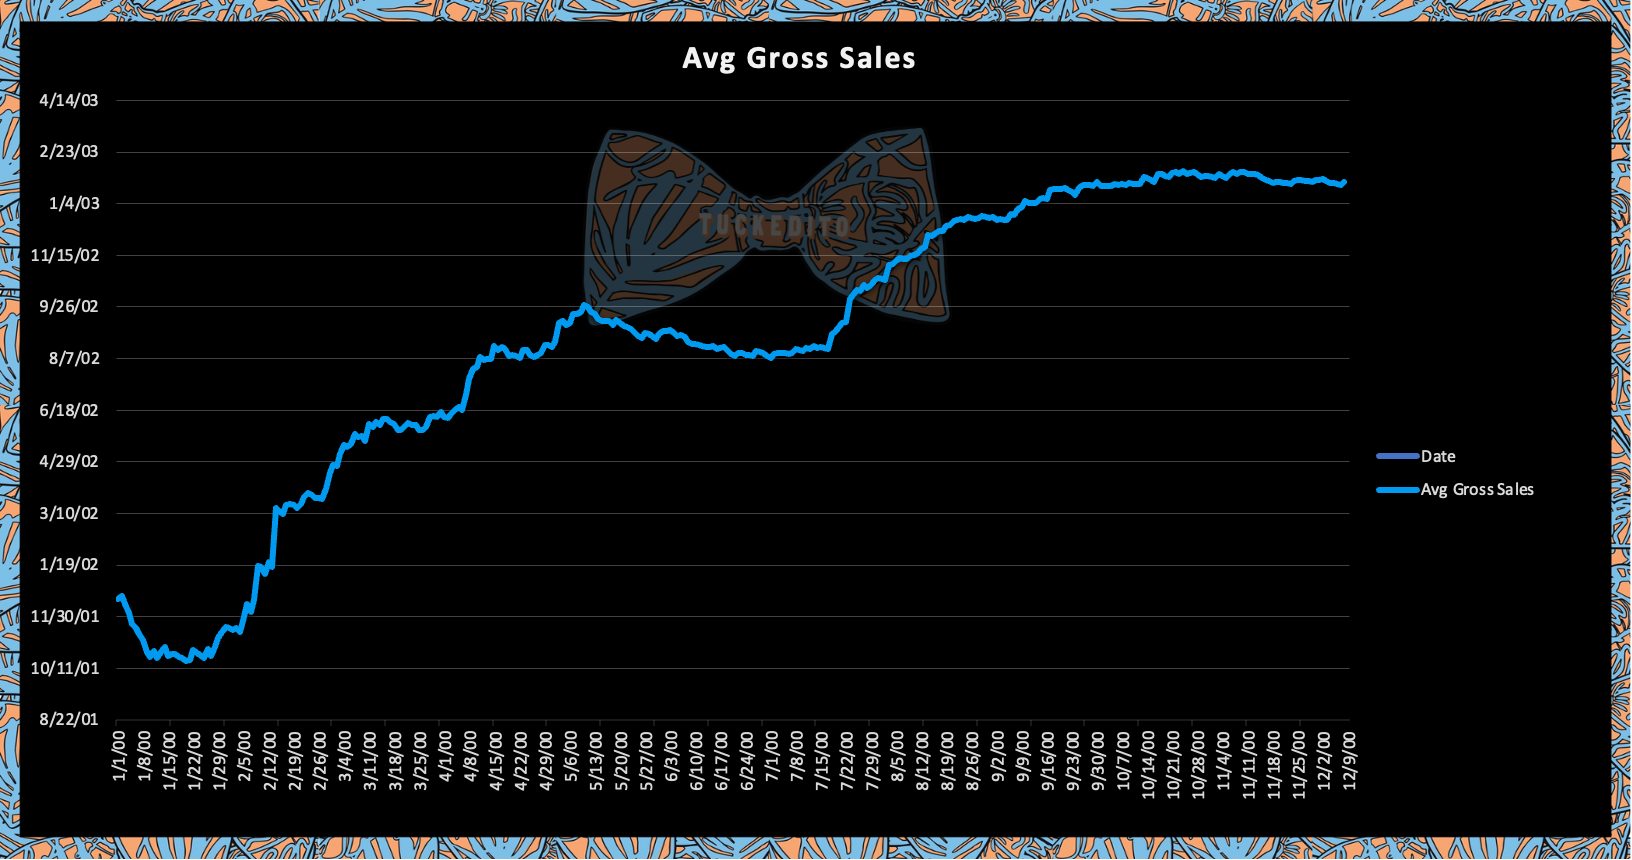
An interesting chart that shows how our sales per event has increased steadily over the last year and a half. I think we're reaching a bit of a plateau here around $1,130. This will be around our minimum for events.
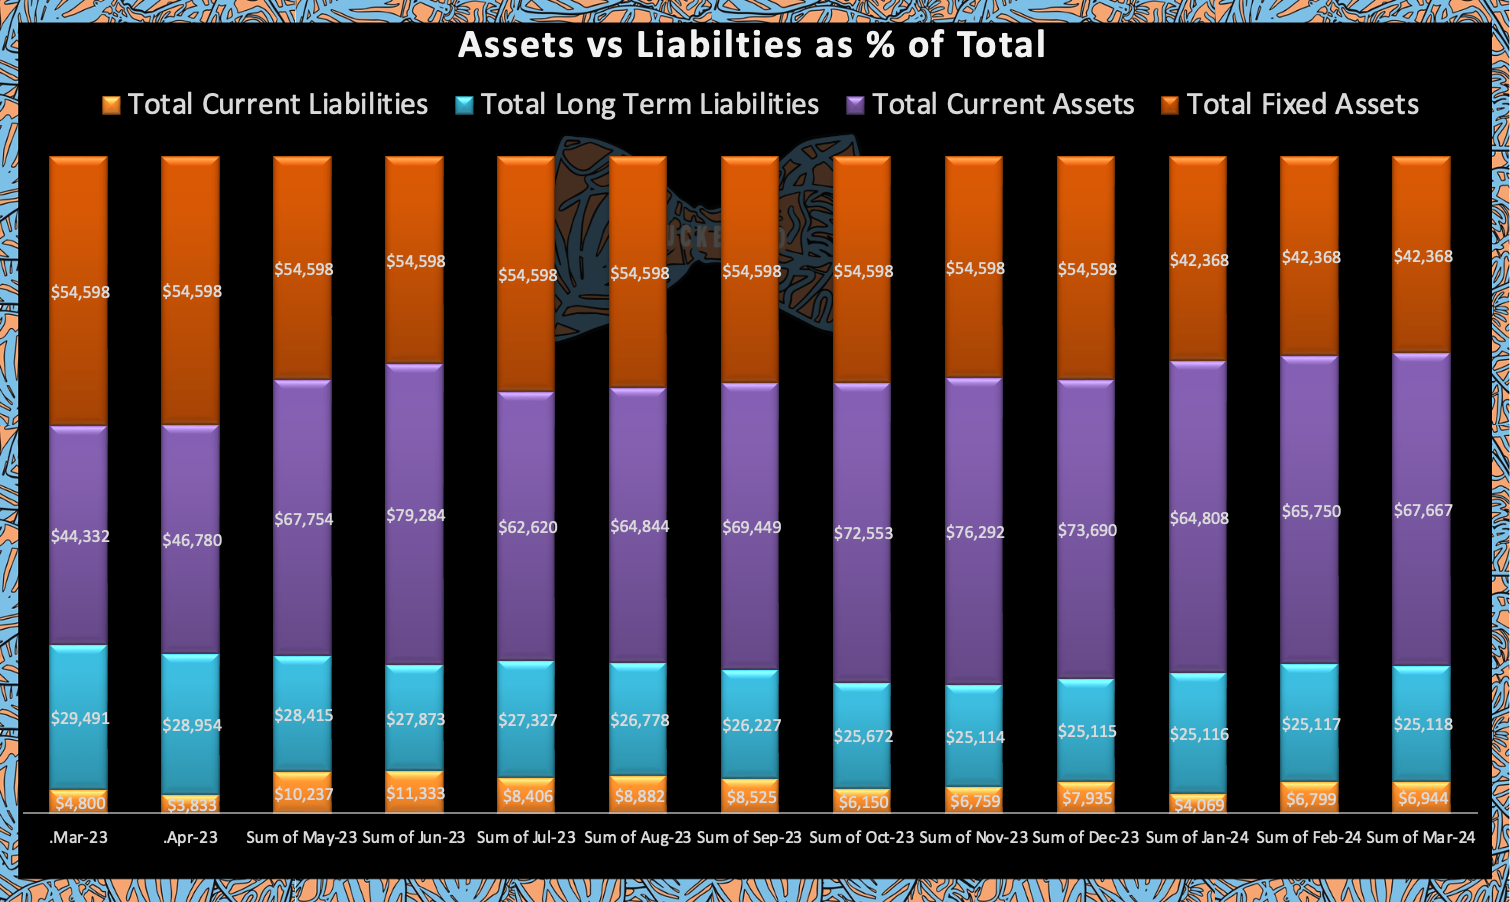
⚖️ Balance Sheet
Chart Update
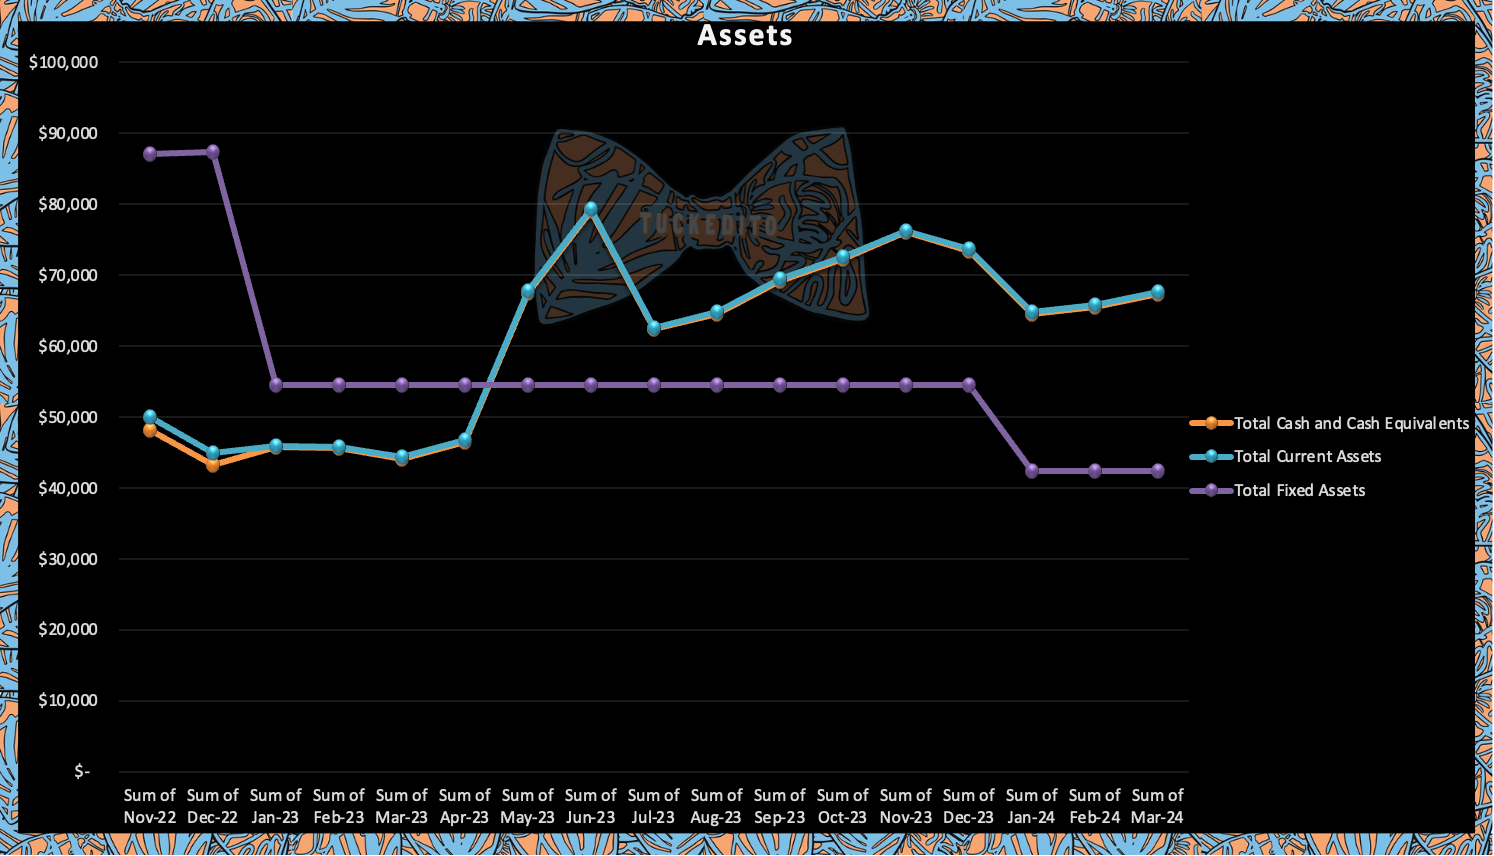
Little bit of rebound. More needs to go into Bitcoin.
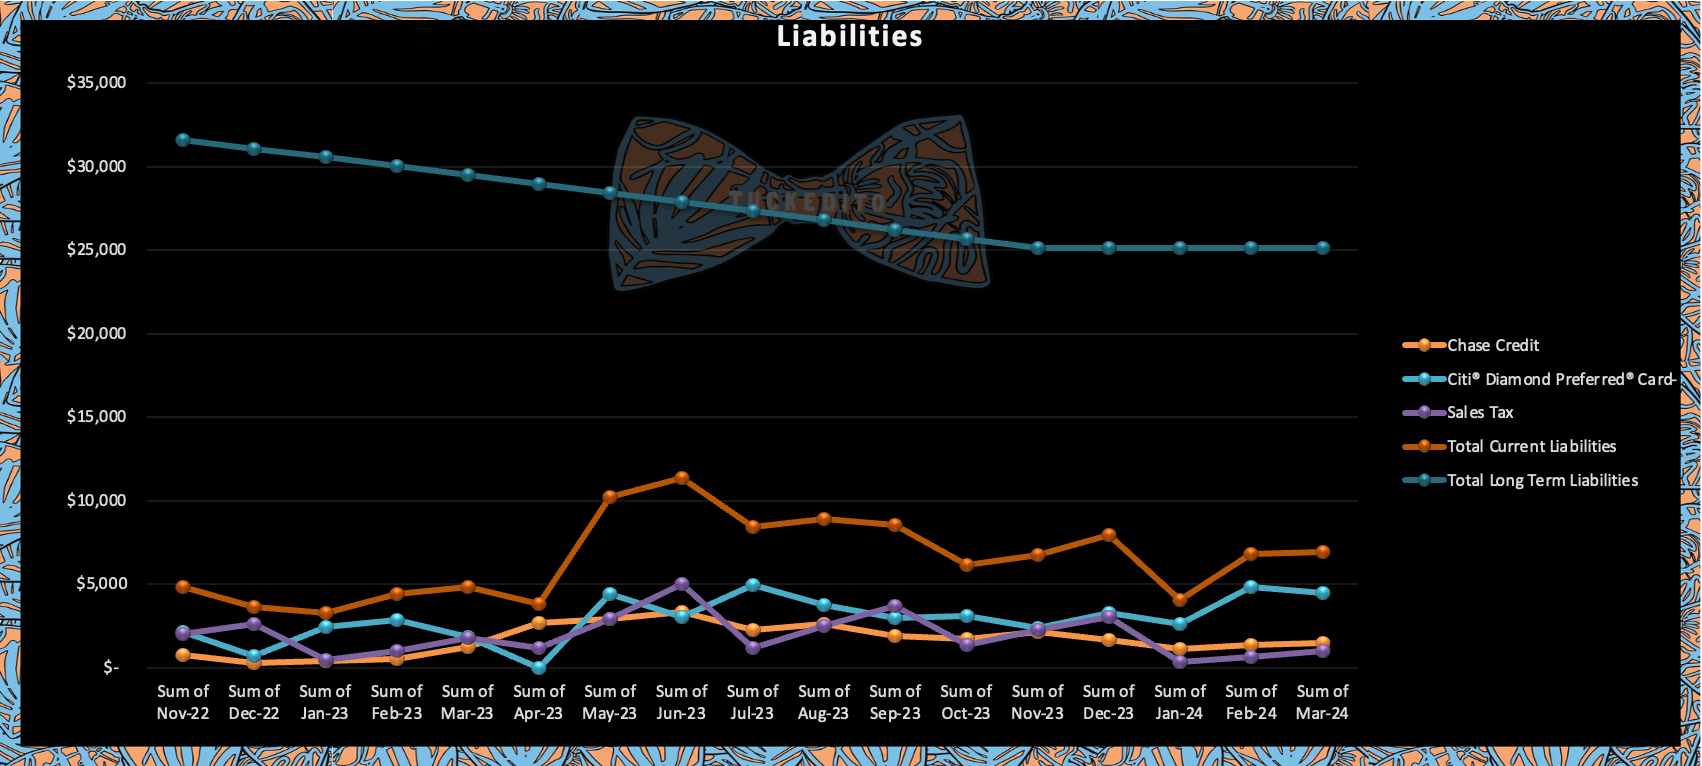
Just paying off debt still.
Cash down further after a deeply negative cashflow month.
🚀 Weekly Sales Projections Analysis
🕵🏻 How to Interpret This Chart:
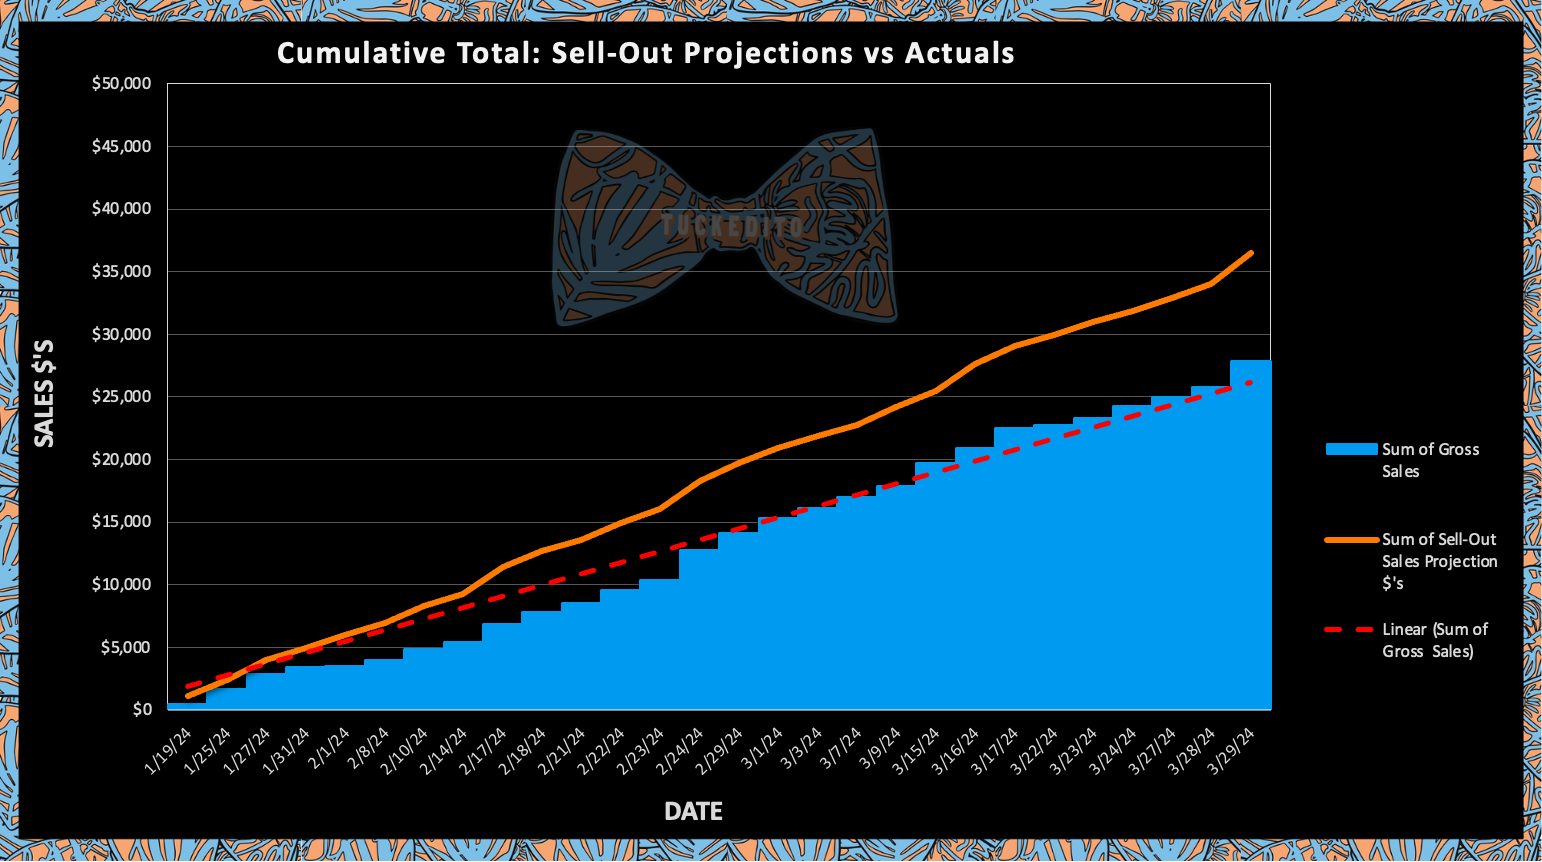
I reset this chart so that it includes only 2024 data. We will see if sales to sell out sales projection tracks at >85, our goal for this year.
The blue represents our sum of gross sales to date ($27k as of today). The orange line shows where our sales would stand if we sold out at every event ($36k as of today). The red line is the trend of our gross sales.
That being said...
Our actuals are 76% of our sell-out projections. So, not a good start to the year.
🗓 Weekly Sales Recaps
This is a compilation of the all weekly recaps from March. This is the summary page we look at after each weekend to see how we did.
The numbers are drawn from our POS system, Square, which compiles sales reports. I take the relevant numbers and compare them to our projections in an easy to interpret chart.
👋🏻 A Few Things to Note:
- "Actual Sales" are net sales, not gross sales. (gross sales vs net sales)
- When actual sales are $0 that means there was a weather related cancellation
- Our projections are if we were to sell out. We have another file where we adjust the projections by percentage to look at different scenarios. (since we know we will not always sell out)
Didn't do many events, so not worth displaying this month.
Improvements to Come
Would love some better ways to look at financials. If you're reading this and have useful ratios or charts I can try out, I'd love to hear from you!
Send suggestions to: tuckedito@gmail.com, instagram dm, fb dm